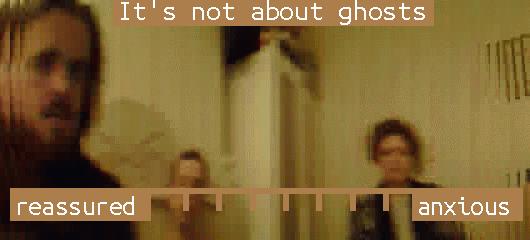
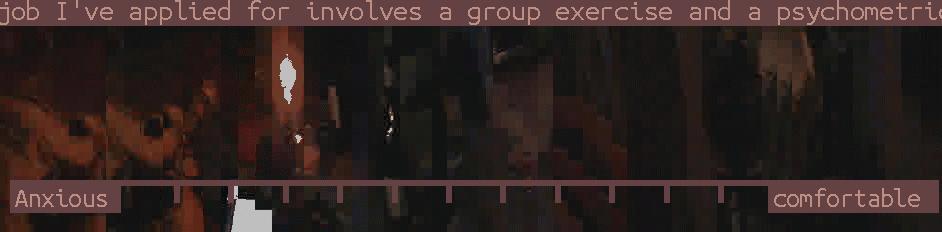
Human spectrograms are a fun exercise for a group to discover its feelings on a particular issue. We used human spectrograms in our (that is, ATF’s) Misbehavioral Codes workshop. This was part of Fossbox’s ‘Sex and Security’ event at Furtherfield Commons, back in March 2015. With a human spectrogram, you are read an ambiguous statement such as “My data is only ever read by an algorithm, but never by a person”. You then arrange yourself along a wall, with one end being ‘Strongly Agree’, the other ‘Strongly Disagree’. For that workshop, however modified it however to emphasis affect, replacing the agree/disagree scale (which is cognitive in emphasis) with an anxiety scale – one end represents comfort and reassurance, the other worry and anxiety.
One of the perennial frustrations of these workshops for me is that they are really brilliant experiences, but at the end of it we lack engaging documentation of the whole event. The software I’ve created was a limited response to this concern, but has opened up other questions through its development.
From concatenated snapshots to glitchy panaromic.
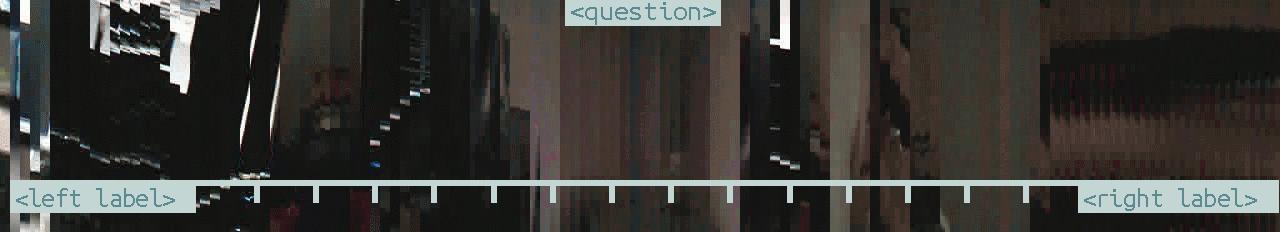
So the software started as an attempt to create a tool to compose photographs of the human spectrograms, appending a question and a scale to create documentation that could be shared in the context of the workshop, rather than something that would be need extensive production work afterwards.
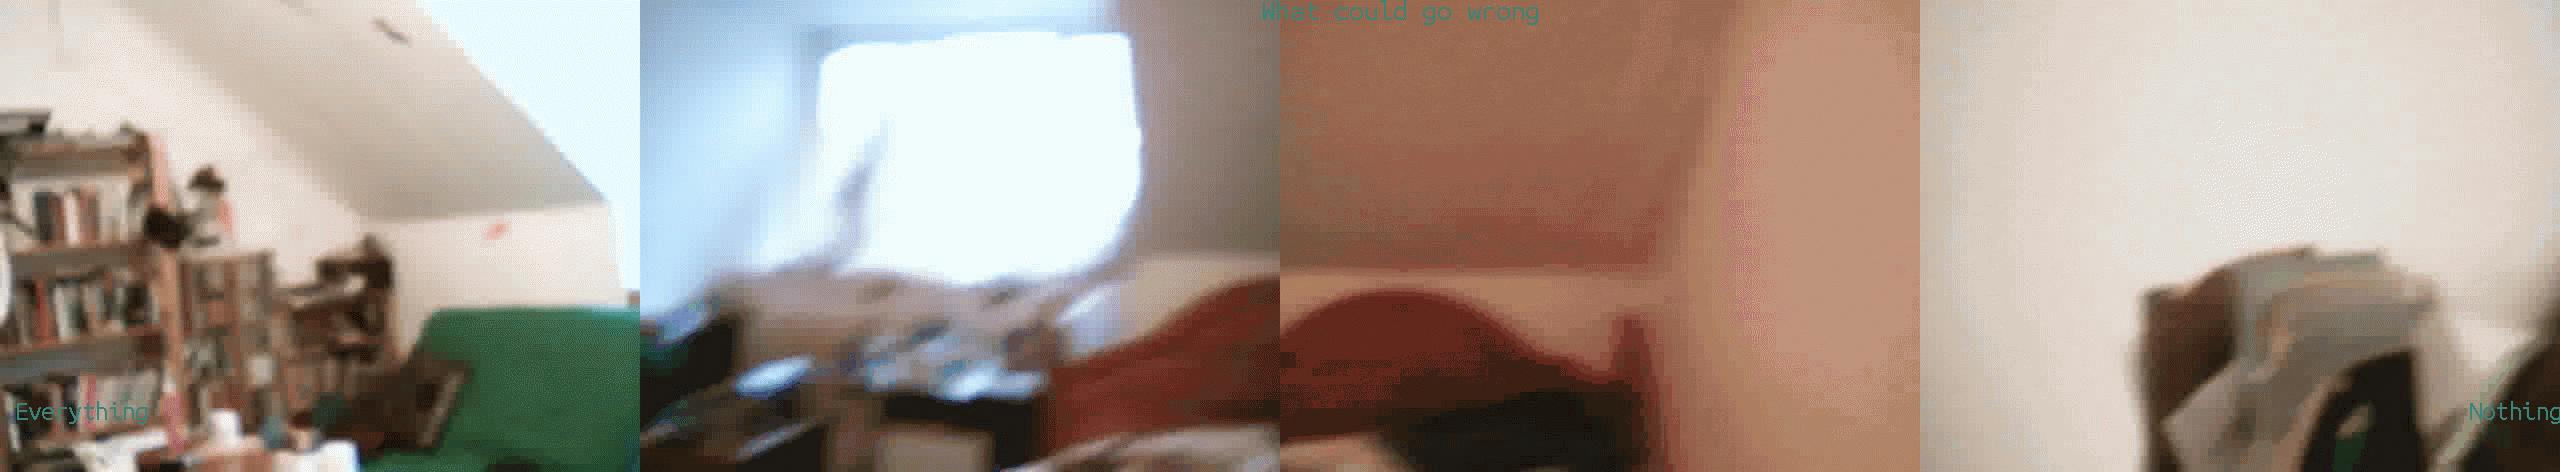


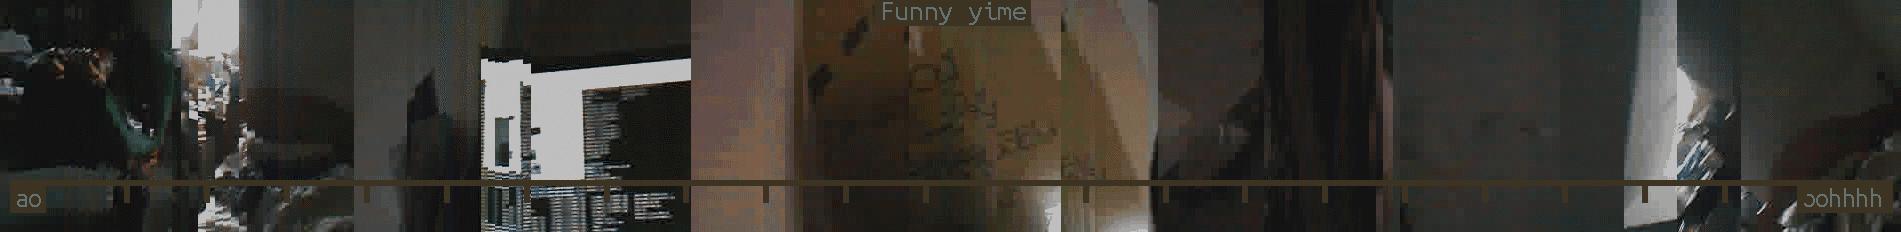
My starting point was this bit of perl code which I found online. At first I made a program to collate the individual snapshots this program produced, but it pretty quickly occurred to me that a great way to do this would be to splice multiple small slices from the image feed and concatenate them into a glitchy panoramic. Basically you turn it on and take a webcam along the length of the group to create an image. Perhaps this was an obvious way to approach this, perhaps I was subconsciously inspired by Nathaniel Stern work hacking desktop scanners, which I experienced vicariously at the Museum of Contemporary Commodities ‘Free Market’.
The method was particularly welcome due to the indistinct nature of the images produced, producing a visually impression of the feeling on the topic without giving any identifying features. Given that we might well want to use such a tool in workshops exploring data security, this was pretty important. Also, the impression it produces, whilst a form of measure, isn’t quantitative in a strict sense. Sure, it features as digital data, but the levels of distortion rendered by the movement of the camera and the low resolution make it difficult to reduce down to data points. Whilst distinct legs might give us one form of quanta, this would be mitigated by groups of bodies and also the fact that the spaces between legs would themselves be unquantifiable.
(incidentally you might want to right click and view image with the recordings on this page to take a closer look. Really they should link to themselves but, you know… Also the two images with legs are what the device is designed for taking - all others are tests!)
But the impression is nonetheless a form of measure. Or at least it affects to be a form of measure. That’s why I found images like the one heading this page interesting. A scale is placed along an image, but it’s not entirely clear to what extent or in what way the image corresponds to it, or even what the scale means in relation to the statement that accompanies it.
Recording bodies
The first iteration of this device was activated at a laptop, and needed to be switched off from there, which meant you needed two people to take a recording. This was less than ideal. But more than this – I wanted to find a way to incorporate the body of the recording individual into the recording, to implicate them and make visible their present. Their gesture and motion already shaped the image but this is backgrounded – I wanted a way to draw attention to it more explicitly.
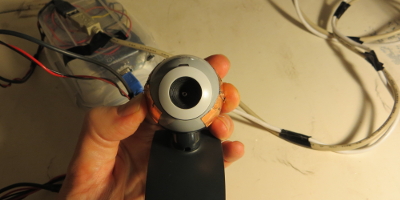
I chose to resolve both issues by integrating a Galvanic Skin Response sensor onto the camera. This involved incorporating an Arduino to relay the GSR data, based on the device produced by Emilie Giles, Alexandra Jönsson and Gareth Foote for Rebooting Computing. The code was substantially reworked so it could feed and receive information from the computer. I retained a similar sound output so the presence of this data gathering would be made known to the group.
The data from the GSR sensor presently determines how wide the slice that’s taken from the webcam (the lower the GSR, the wider the slice) and how often slices are taken (the higher the GSR, the higher probability of a slice being used). There may be more interesting ways to use and make this data visible; I’ll probably find a way to make it distort the scale bar as well, but it can definitely be pushed beyond it.
The existing code is located on GitHub. I’ll write a separate post on how to use the code and make the GSR sensor at a later point.
Final reflections and futures
The incorporation of GSR was partly prompted from my studies of chronophotography and the desire to replace metrical sampling with something embodied. The actually incorporation of GSR into the collation of the software should be taken further, it should have a more active role in the recording process. Unlike a metrical timer, it has little obvious discretion within it from which to create a image taking point, but this could be generated. A deeper entangling of these processes could be rewarding.
It would be very easy to incorporate heart-rate for a single person, but this would limit the ability of others to use the device easily as I would need to transfer the cheststrap. I could use an ear-based heart monitor but I have found them unreliable. It might be fun to experiment nonetheless.
Going beyond the specific technical form employed here, the slicing mechanism could also be explored through audio, for instance micro-time slices or heterodyning sound to particular frequencies. We could ask people to adopt different pitches according to their feeling, or utilise the spectrogram arrangement with a good stereo microphone to locate voice along it. It’s not immediately clear what would be generated – would we create a sonic scale, where the beginning is one emotion and the end another? Should such a track also have appended to it the question and the scale e.g. as computer generated text or a recording of the question being asked? Or could it generate an image from the sound – and how would we avoid this sound being visualised in a clichéd lexicon, a stereotypical graphing?
Finally I should also experiment with other context for using this device, bring it beyond the original workshop context. I want to retain the analytical and evaluative focus however, and not produce aestheticised imagery.